The Broker Inventory Report shows a snapshot of member and office listing activity during a selected time period.
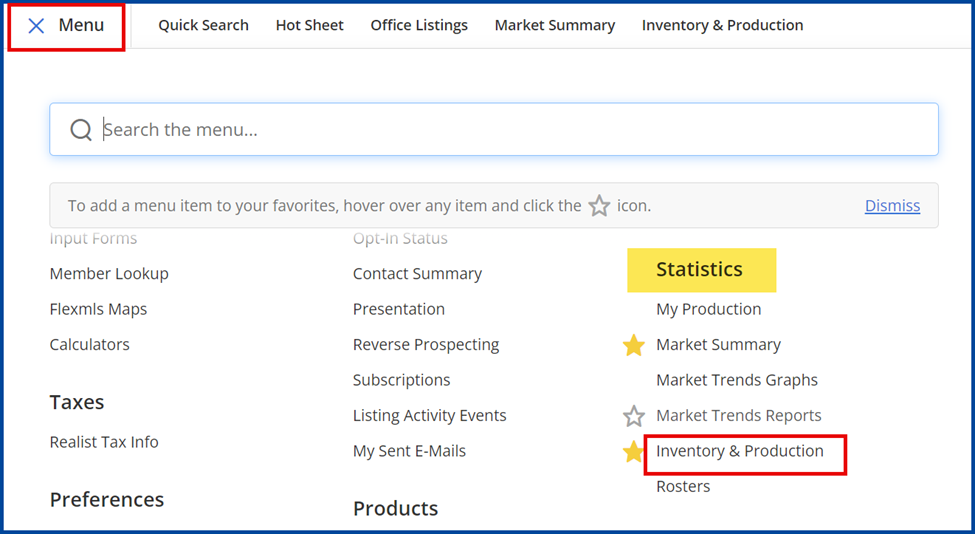
- In Menu, under “Statistics,” click on Inventory & Production.
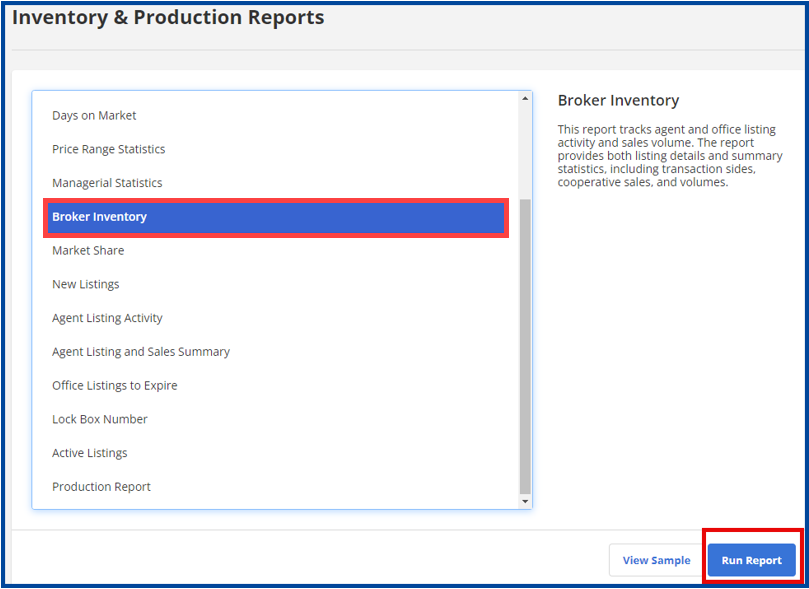
- Scroll down to select Broker Inventory, then click Run Report on the bottom left of the page.
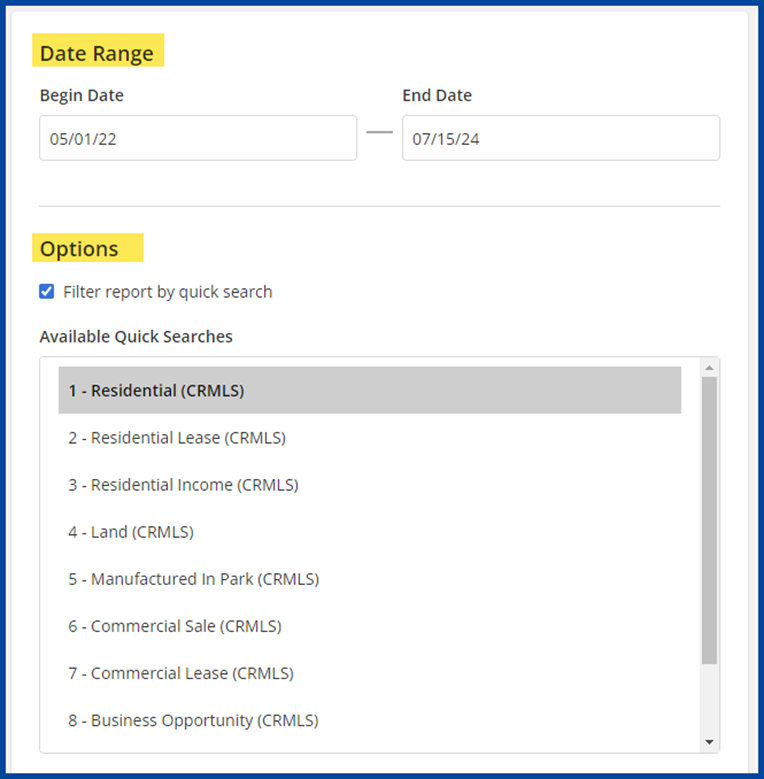
- On the next page, you can enter a “Date Range” (if applicable). You also have the option to check “Filter report by quick search” to use a quick search to generate more specific statistics.
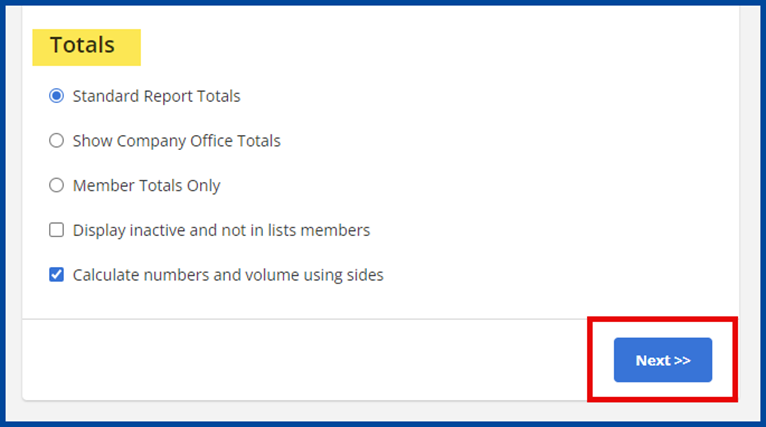
- Select one of the following report types:
- Standard Report Totals: Displays totals by office, then member
- Show Company Totals: Displays totals by company, then office
- Member Totals Only: Does not show totals for the office or MLS.
Once you have chosen your report type, you can also opt to:
- Display inactive and not in lists members
- Calculate numbers and volume using sides: Each sold listing has two sides – Listing and Selling. The listing member and selling member are each credited with a “side,” or in the case of co-listing or co-selling members, half a side. The Calculate numbers and volume using sides option affects how the numbers for sales are totaled. When you select this option, sales in which a member is both the listing and selling agent count as double volume. If you do not select this option, those sales are counted at their regular volume.
- Click Next
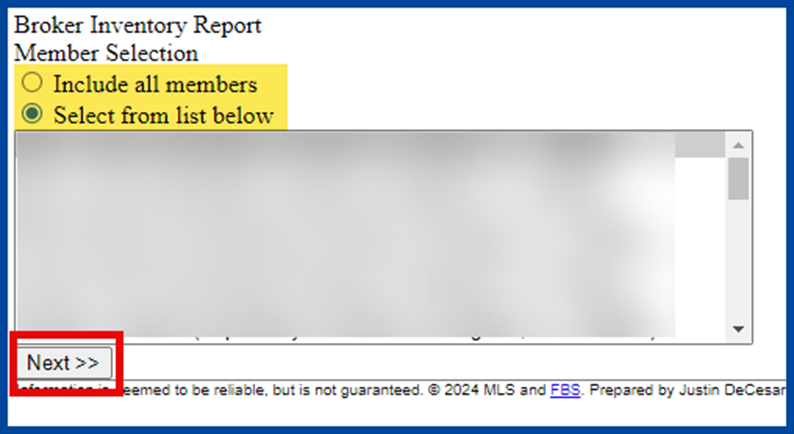
- On the next page, you have the option to either “Include all members” or “Select from list below.” After choosing, click Next.
You will see a Current Member Stats page, such as the example below:
Your report will also display a table of Brokerage Stats compared to MLS Board Stats. The Percent Difference table shows the number and dollar value of listings, with a percent differential based on the value of listings for the company compared to the entire MLS.
