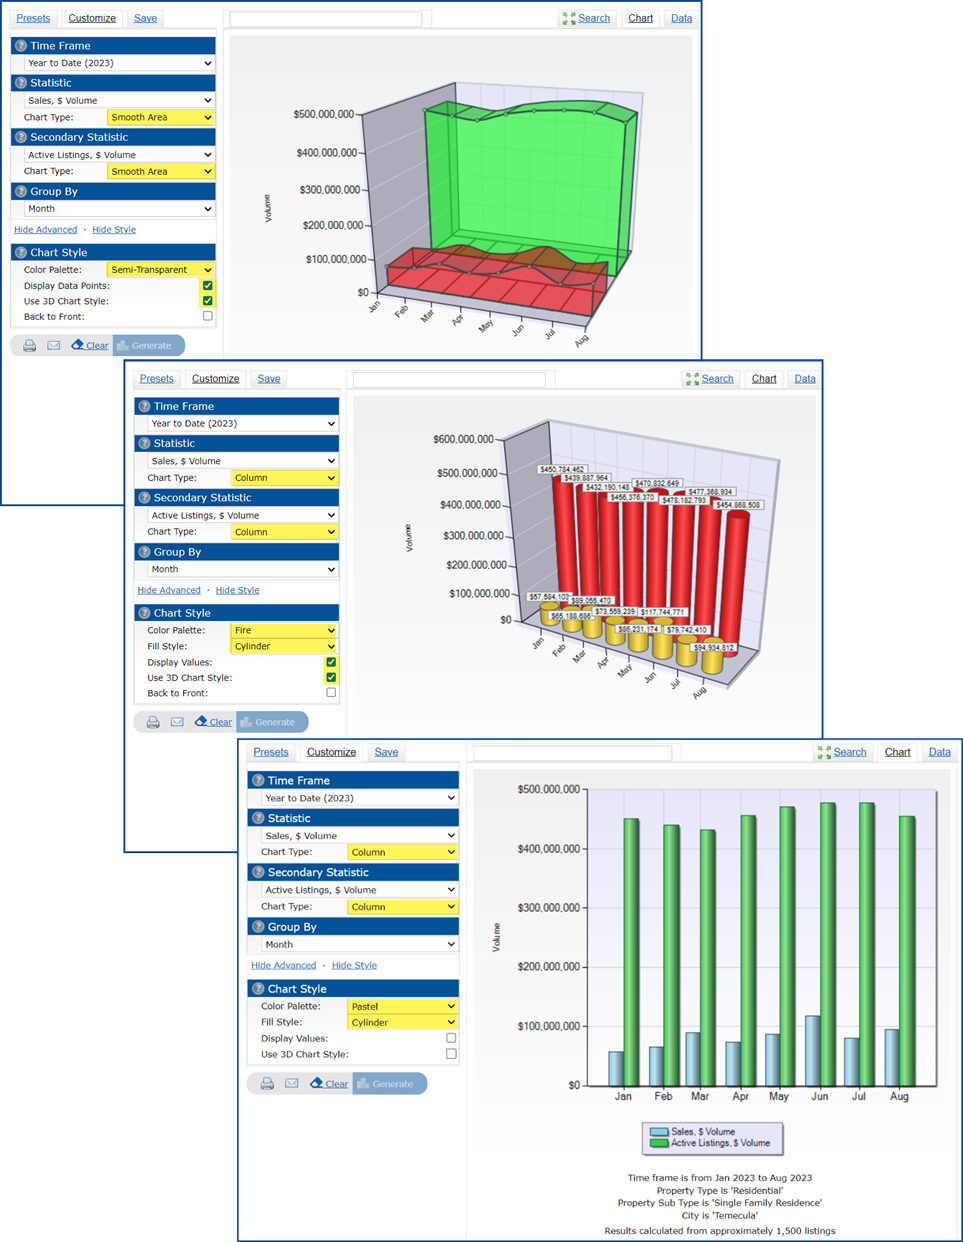
With statistics you can analyze market trends and activity for Residential, Residential Income, Residential Lease, Land/Lot, Mobile properties, and Commercial properties. Using the customized Stats feature, you can also generate Agent ranking reports.
Follow the steps below to learn how to generate stats, create charts and graphs, and export data.
Jump to:
Generating Tabular Stats
Generating Statistical Charts and Graphs
Changing Your Statistic Search Criteria
Customizing and Saving a Preset
Exporting Statistical Data
Generating Tabular Stats
- Perform a quick property search with criteria that match the listing to analyze. Click Results.
- From the search results window, click the Stats button at the bottom of the screen.
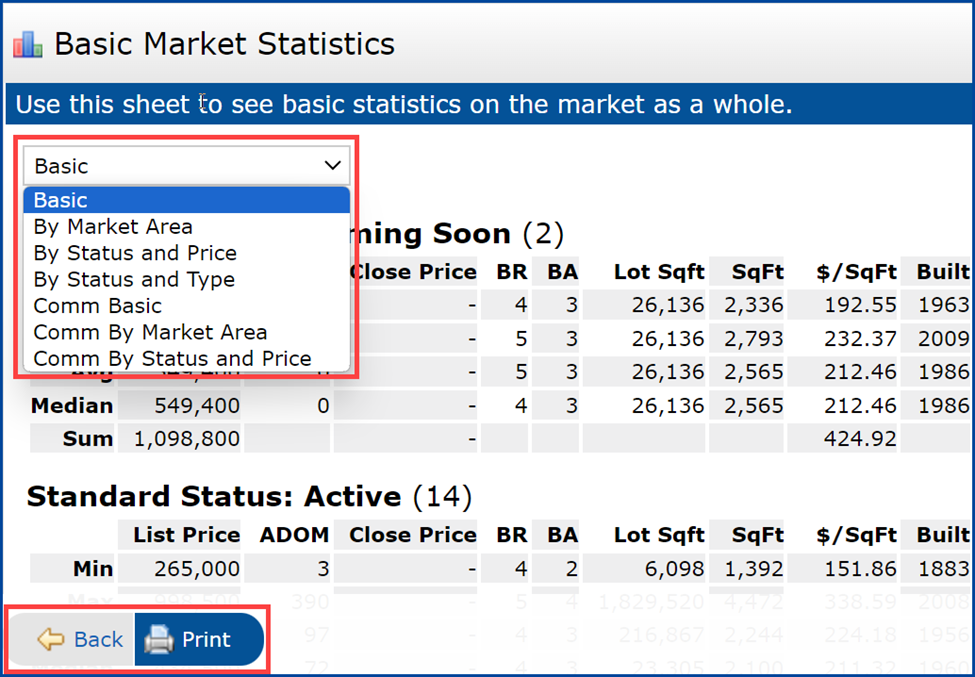
- Select Tabular in the pop-up menu.
- Select the type of stats you would like to generate in the drop-down menu.
- You can print these statistics using the Print button at the bottom or go Back to your search results.
Generating Statistical Charts and Graphs
The statistics module allows you to analyze market trends and activities for properties, create statistical charts and graphs, and export statistical data. Use the system presets to quickly generate standard charts and graphs or customize them with your own parameters to create a higher-level view of the market. Follow the steps below to get started.
Click on Stats.
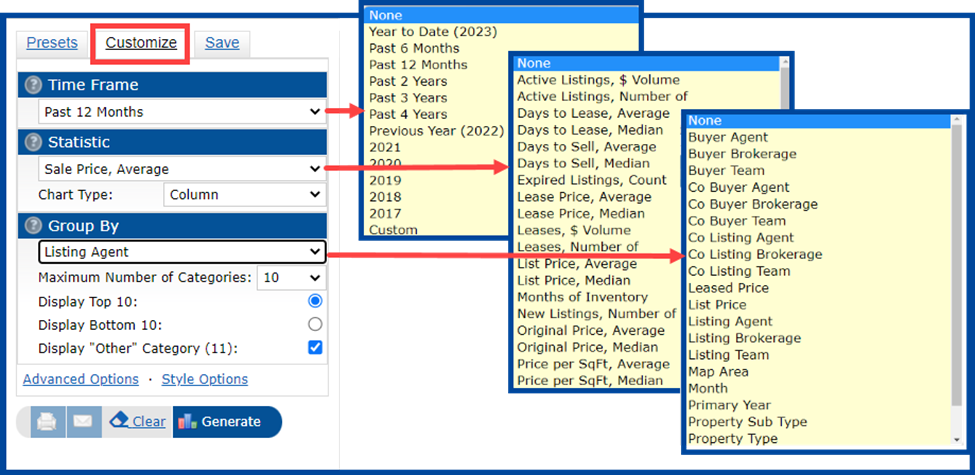
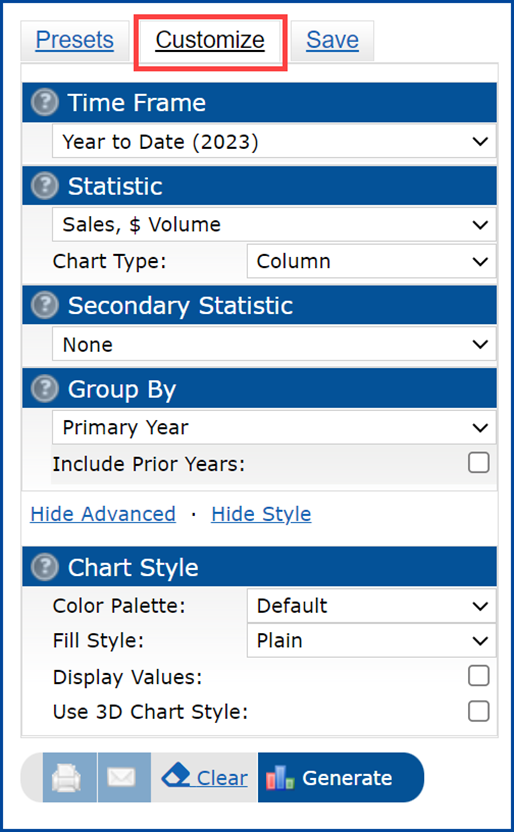
- Click the Customize
- Select the Time Frameand Statistic you wish to search by.
- In the Group By drop-down list, you will find the option to select among Listing Agent, Listing Brokerage, Selling Agent, and Selling Brokerage. Please note that not all of the options are available.
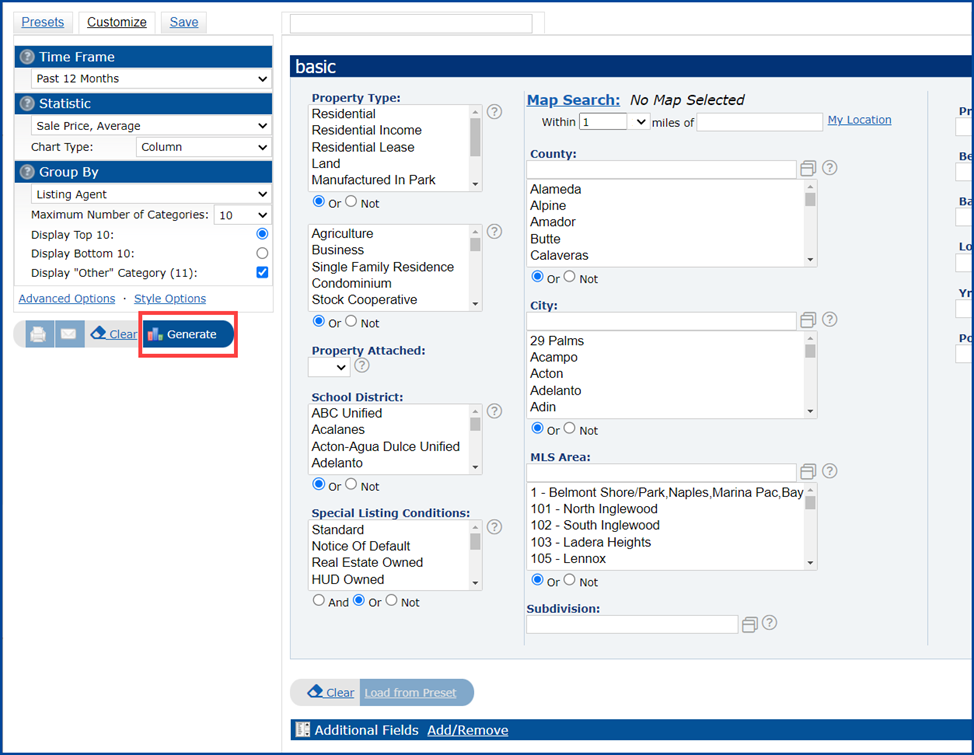
- Enter your search criteria and click the Generate button to view your results. You can keep your results more general or specify to your interests.
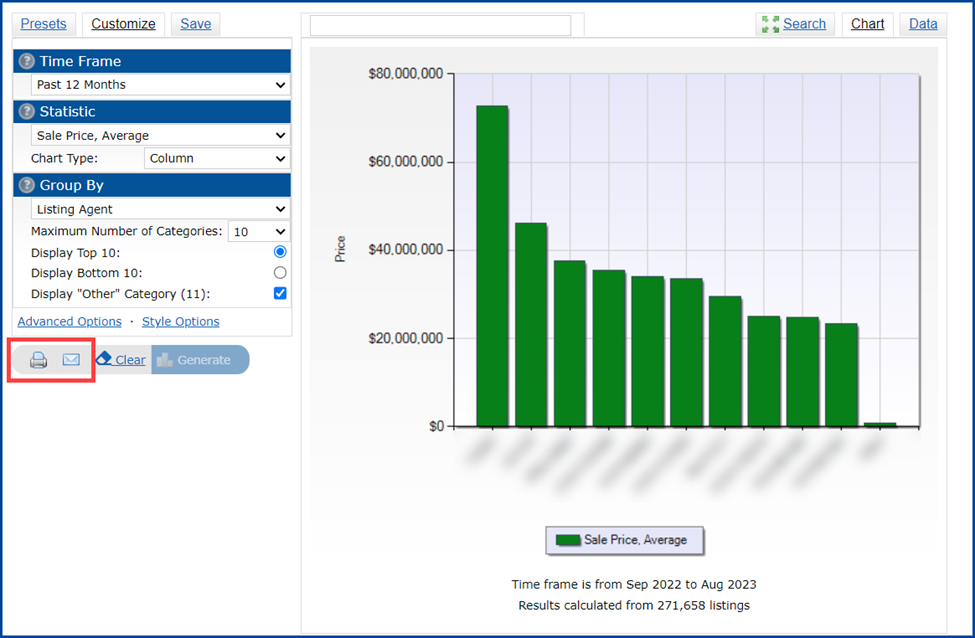
- From the results page, you may print or email the results.
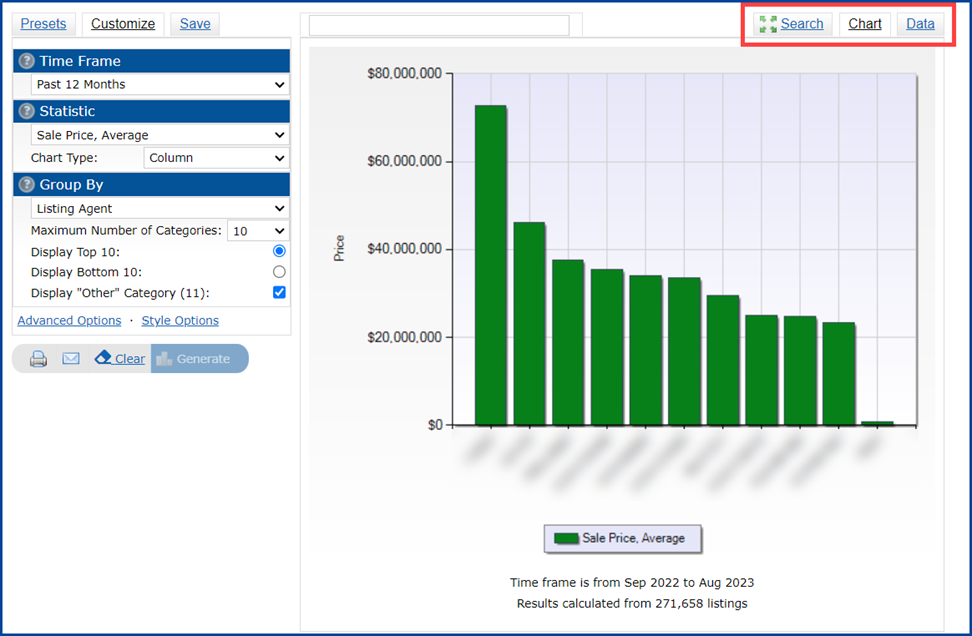
Once the system has generated the stats, there will be a graph on the right where you can choose to see the Data or modify your Search.
Note: You can also select one of your saved Presets. To customize one of the System Presets with your own criteria, see “Customizing and Saving a Preset.”
To see a larger display, click the Expand Chart icon at the top right corner of the screen. To return to normal view, click the same icon to Shrink the chart.
Changing Your Statistic Search Criteria
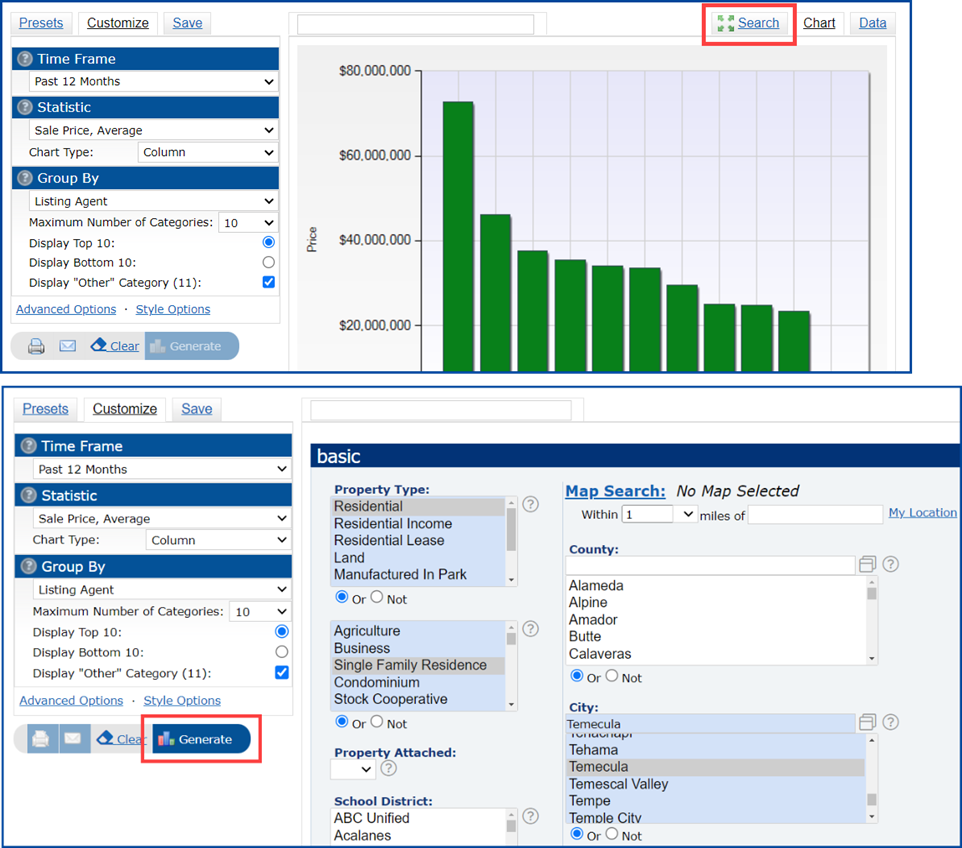
- Click the Search tab to refine your original search.
- Revise your criteria as necessary.
- Click the Generate button again to regenerate your chart using your new search criteria.
Customizing and Saving a Preset
Follow the steps below to create your own System Preset.
- Click the Customize tab and adjust the settings as desired using the available fields.
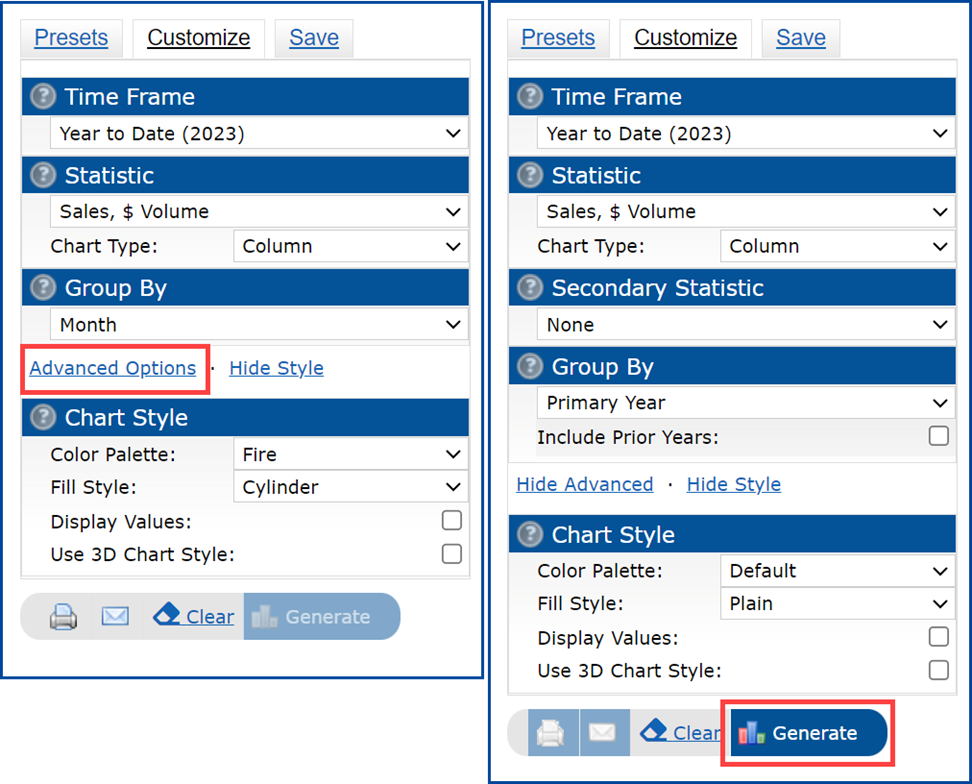
To customize the color and style of your chart, click Advanced Options and select settings.
Click the Generate button to view your customized chart. Chart types vary based on the settings you’ve selected.
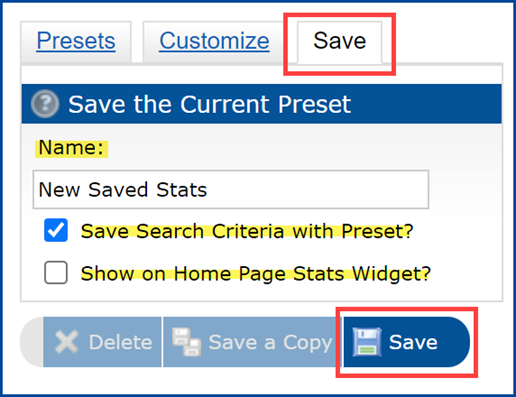
- When you’re finished customizing your preset, click the Save tab.
- Type a name for your search in the Name field. To create a preset from your search, select the Save Search Criteria with Preset? checkbox.
- To display your Preset on the Home tab, select the Show on Home Page Stats Widget? checkbox.
- Click the Save button to save your custom preset.
Exporting Statistical Data
Follow the steps below to view and export your data.
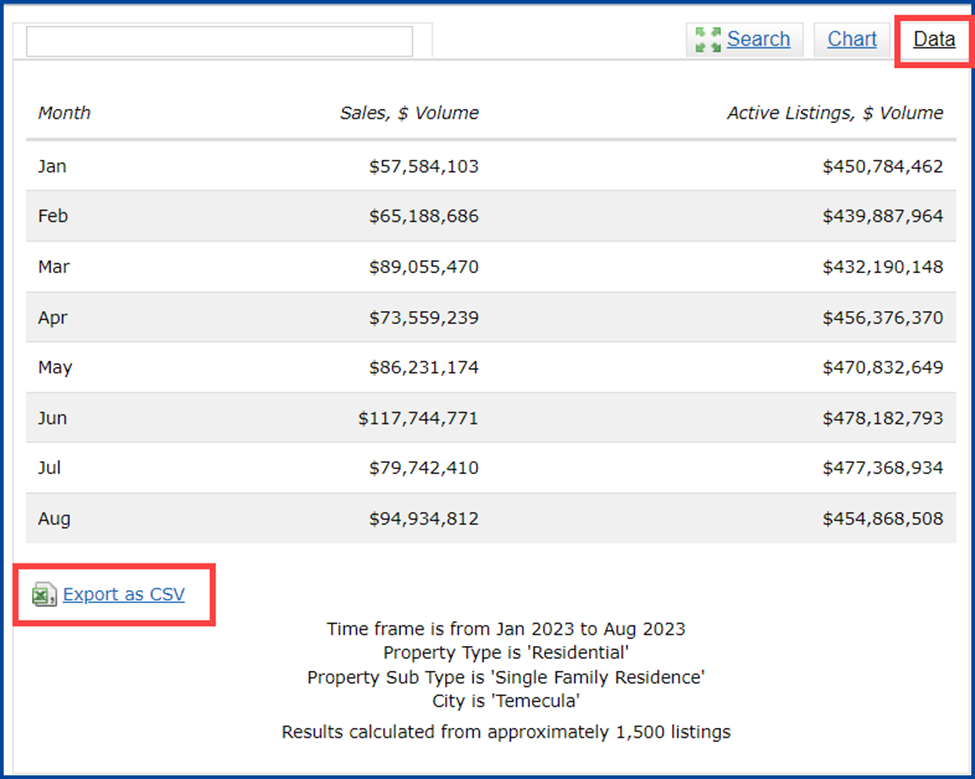
- Click the Data tab to switch from the chart view to the data view.
- In the data view, click Export as CSV to export and save your data.

