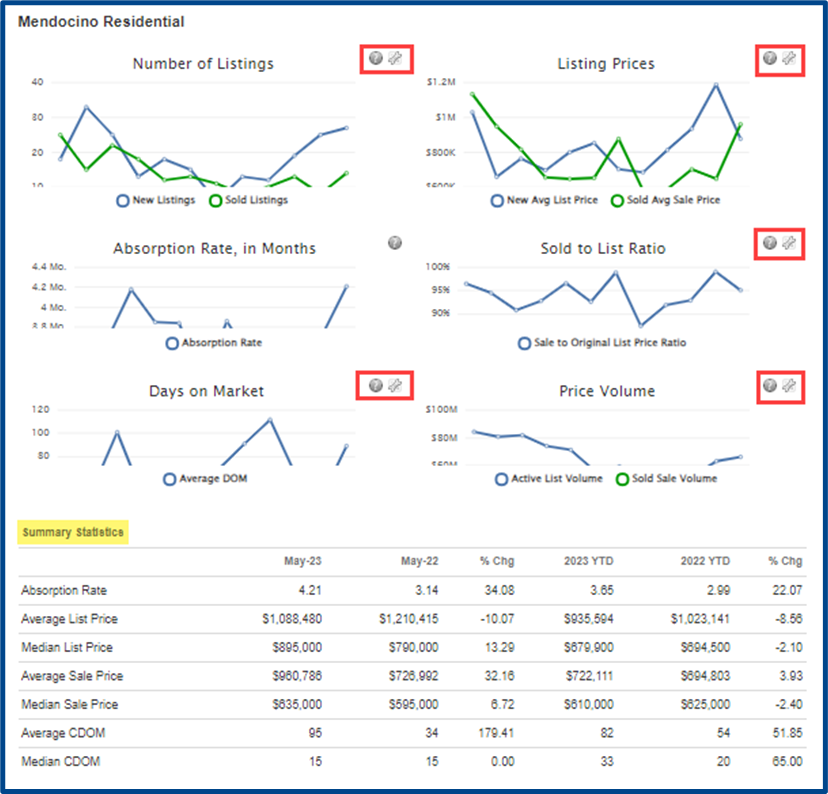
Market Summary Statistics represent your market through a series of graphs and tables that illustrate trends in the Number of Listings, Listing Prices, Absorption Rate, Sold to List Ratio, Days Active in MLS, and Price Volume over a 12-month period. You can customize how these graphs appear and what info they include. Use this feature in Flexmls to gain a bird’s-eye view of what is happening in your real estate business’s market.
Follow these steps to find your Market Summary Statistics in CRMLS Flexmls.
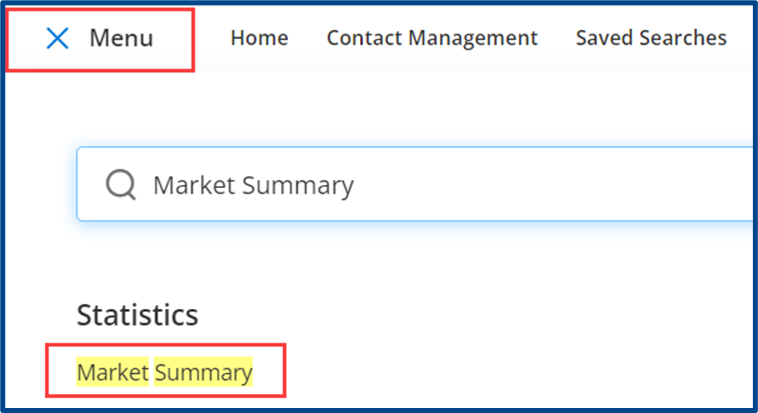
Search for the Market Summary from the Main Menu or locate it under the Statistics menu.
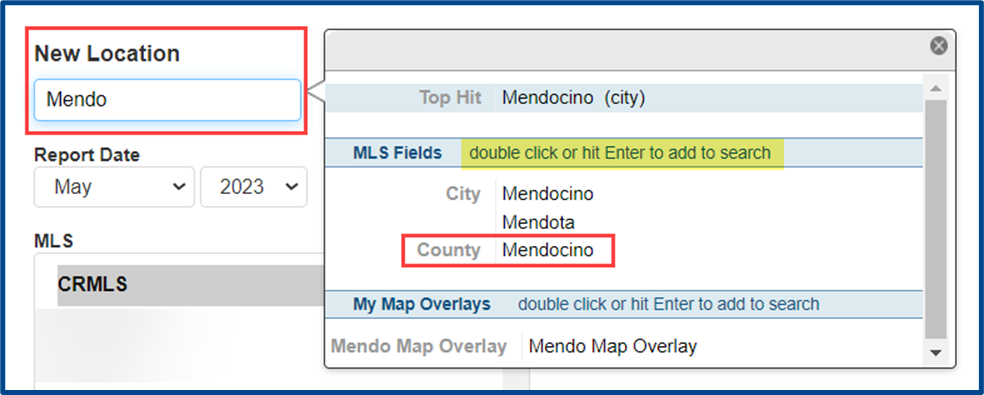
Click Customize and select New Location from the drop-down to update the parameters of the report, including location, date, and property type.
Set the New Location by searching for a geographical boundary. For this example, we used Mendocino County.
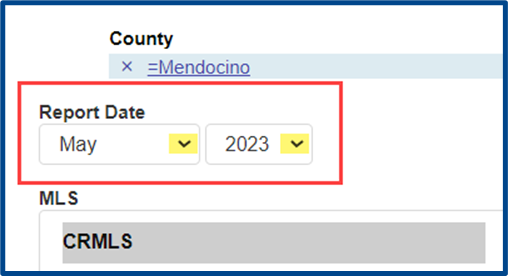
Set the Report Date using the drop-down arrows. The report date will default to the most recent complete month.
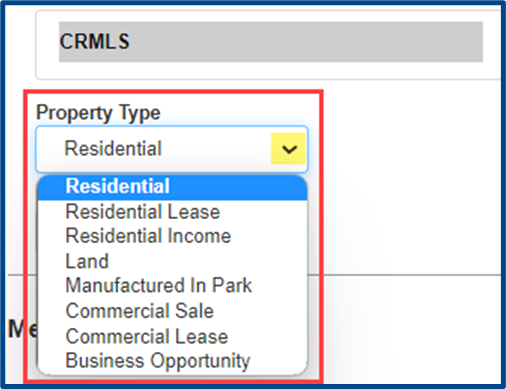
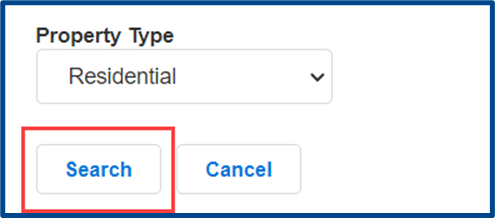
Filter the report by Property Type using the drop-down arrow.
Select Search to update your preferences and return to the report.
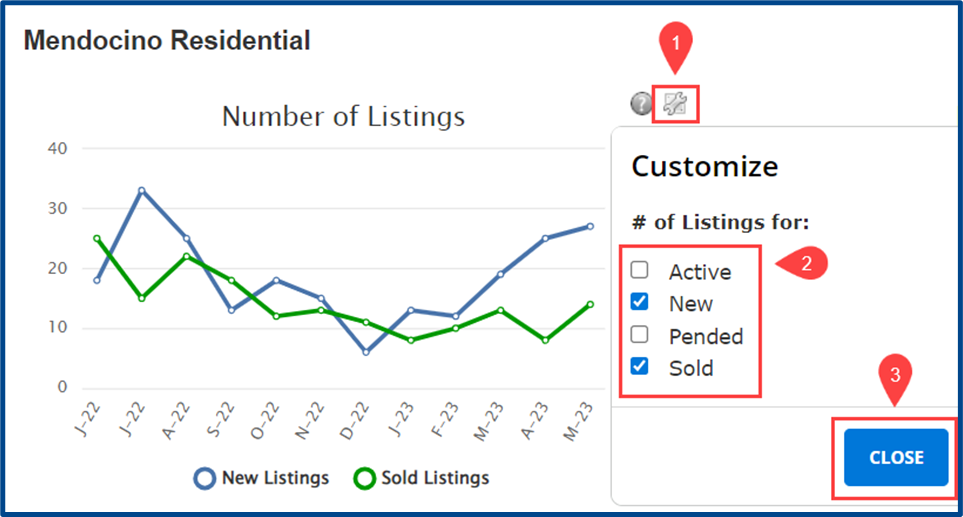
You can change how the data is displayed on all graphs except Absorption Rate.
- Select the tool icon beside the graph.
- Choose your customization options
- Select Close to update the graph
Note: There are different customization options for each statistic.
Here is a preview of what your Market Summary Report may look like (with customization options outlined in red):
When you are finished reconfiguring your graphs, use the action items at the top right to Export, Email, or Print the report.
Note: Your location preference will be saved for future use. You can update this at any time.
