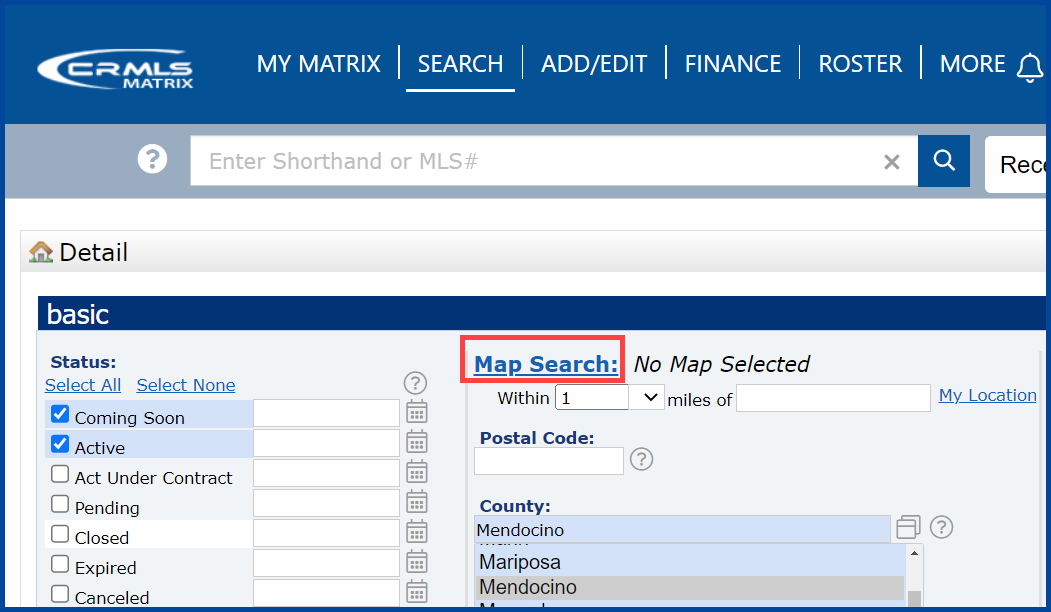
The CRMLS Matrix platform allows you to overlay Map Layers when performing a map search. These layers can be helpful in determining boundaries, parcel characteristics, market trends, and points of interest.
Follow the steps below to access the Map Layers in the CRMLS Matrix platform.
1. Click the Map tab from any search form.
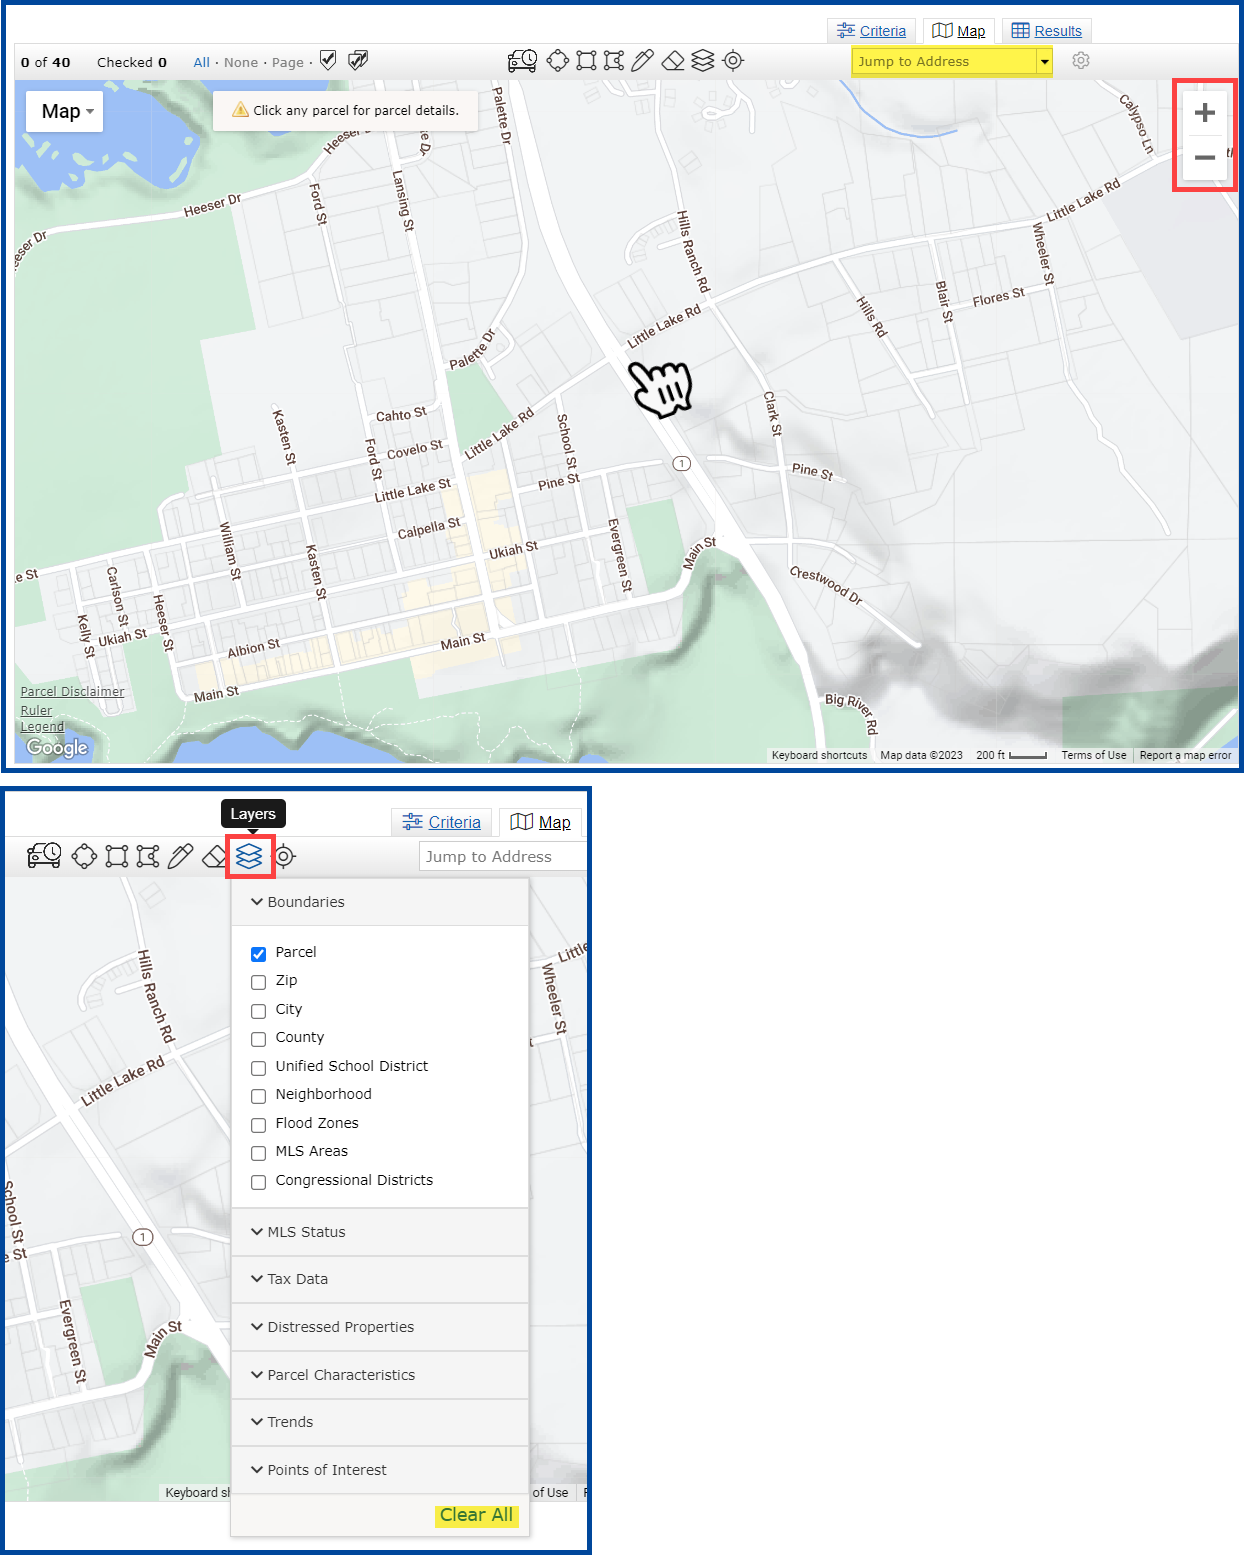
2. Click and drag the map or zoom in and out to your desired location.
Note: Use the “Jump to Address” box to quickly locate a specific map area.
3. Click the Map Layers icon to choose which of the following layers to activate.
Note: Click a section panel to expand each category. Click the “Clear All” button to reset the map layers.
Layer Categories:
- Boundaries: Contains colored delineations of areas by Parcels, Zip Codes, City, County, School District, Neighborhood, Congressional Districts, Flood Zones, and MLS Areas.
- MLS Status: Listing status can now be visualized as a layer on the map.
- Tax Data: Pins represent each property which has had a recent sale recorded in public records data.
- Parcel Characteristics: Contains detailed information about individual properties.
- Trends: Contains aggregated market trends information available for condos, single-family residences, or both, by zip code and neighborhood aggregation levels.
- Points of Interest: Contains Bing provided local business and community location markers.

