Hazards & Risks reports are now available for purchase and provide property-level information for a variety of risk types, including:
- Earthquake – Probability, severity (shaking/damage), soil types, and spectral acceleration
- Wildfire – Based on a combination of brushfire data, proximity to high-risk areas, recent fires, and more factors
- Wind & Storm – Tornadic, straight-line, and hurricane event risk
- Crime – Neighborhood statistics for common property and violent crimes
- Regional – Including hail, lava, tsunami, and sinkhole risks
- Distance to Fire Station – An important first-responder metric
- Roof Age – Based on construction and permit data

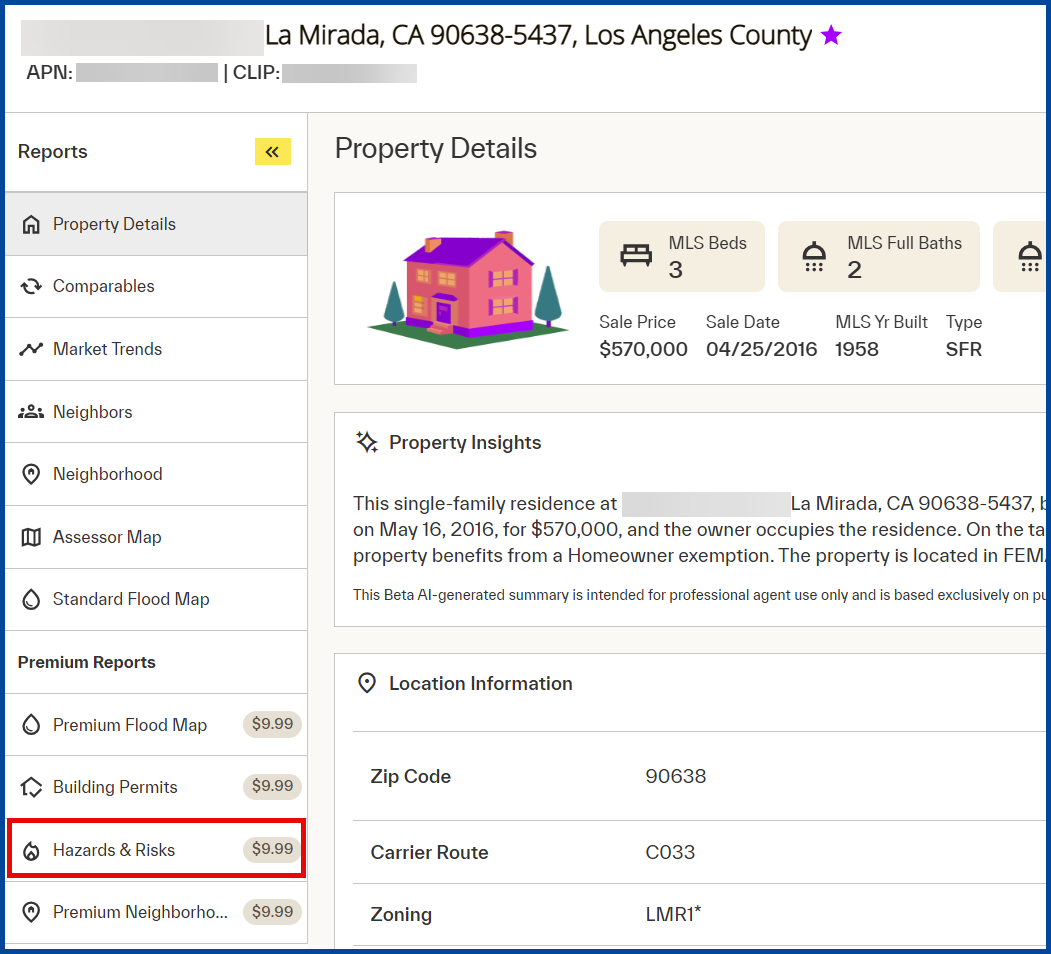
From the Property Details report, select the Hazards & Risks report.
Purchasing a Hazards & Risks Report
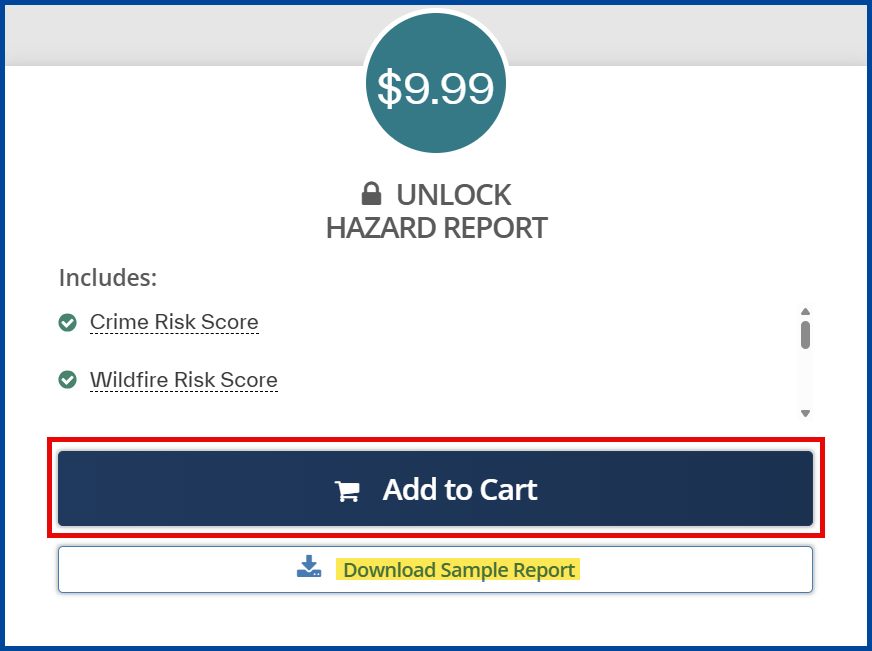
From the Hazards & Risks report, select Add to Cart.
Note: You can add multiple premium reports prior to checkout.
Select the Cart icon at the top right of the screen to continue the checkout.

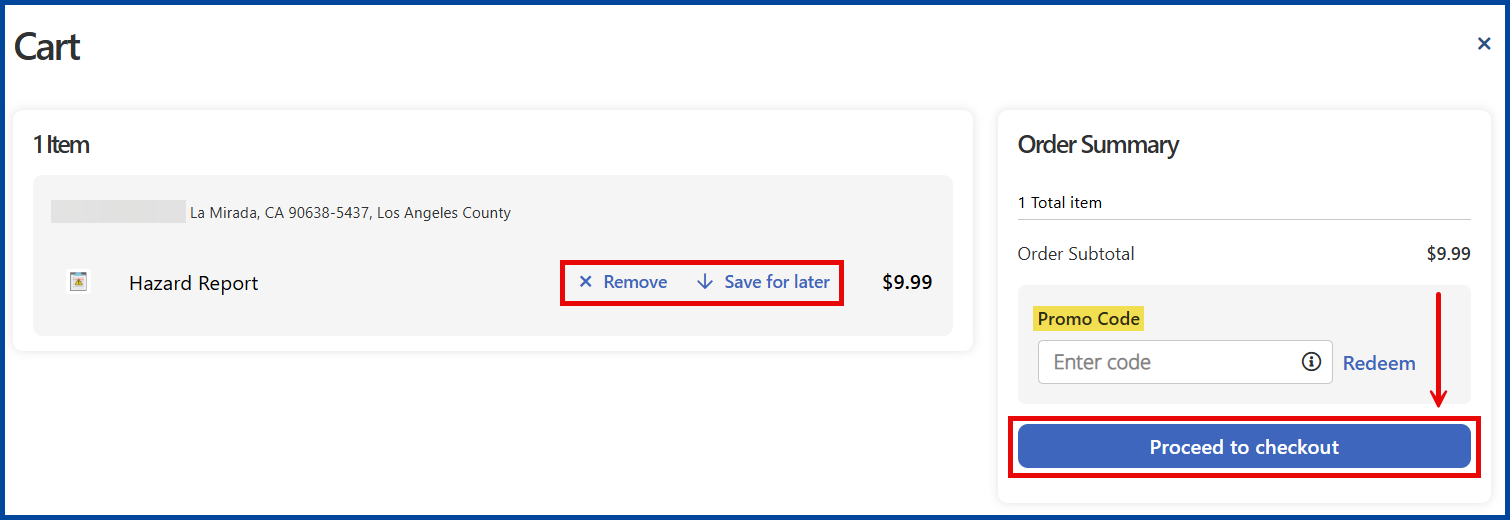
From the Cart page, select Proceed to Checkout or choose to “Remove” or “Save” the report for later.
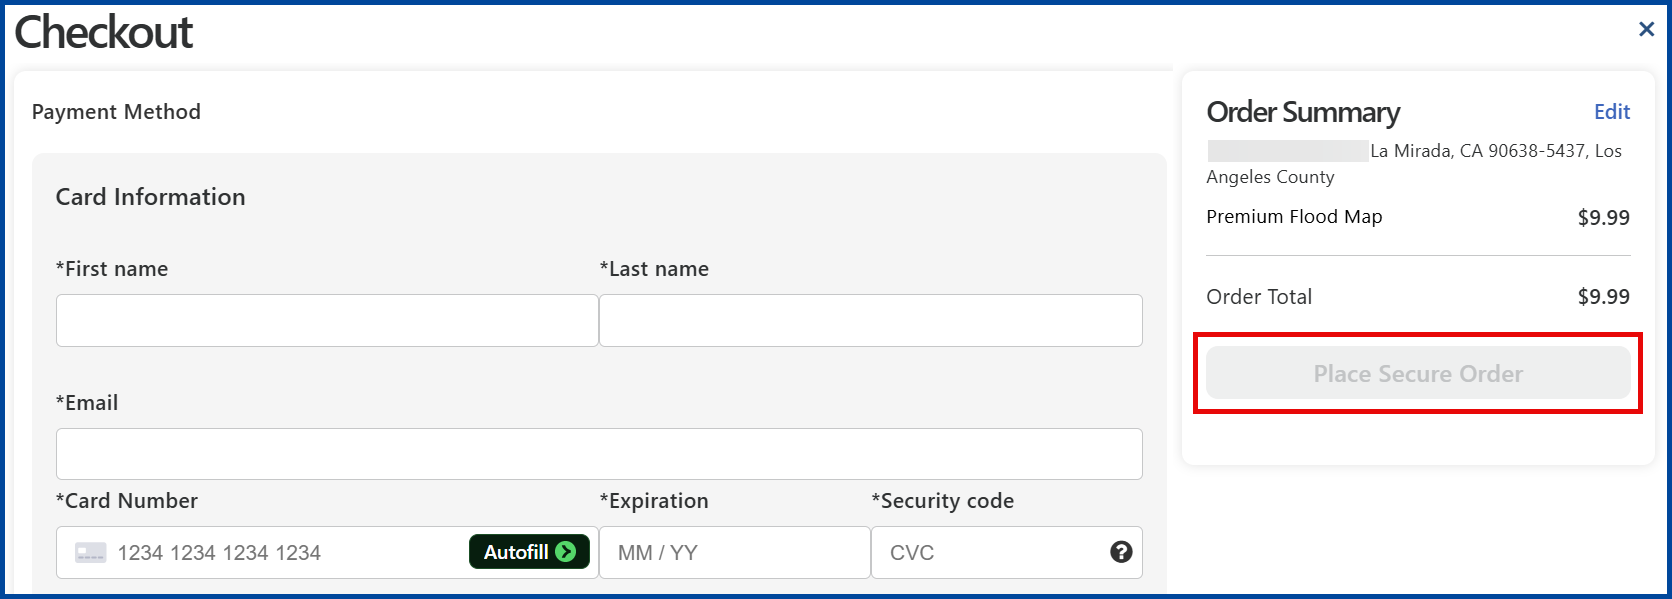
From the Checkout page, add required card and billing information to Place Secure Order.
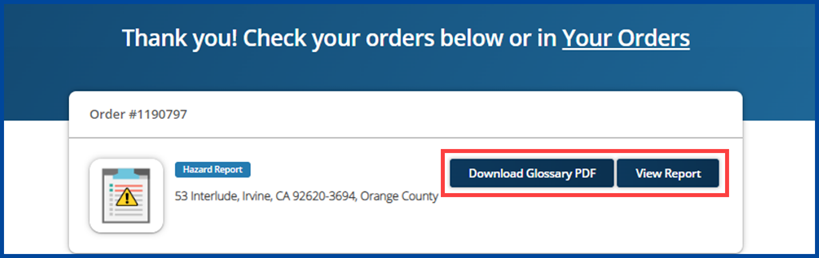
Once you have purchased the Premium Flood Map report(s), you’ll see an order confirmation page. If you purchased multiple flood map reports during one transaction, each Premium Map Report will appear on the same order confirmation page with its own View Report button.
Due to the length of the Hazards & Risks report, a Glossary PDF is available to download.
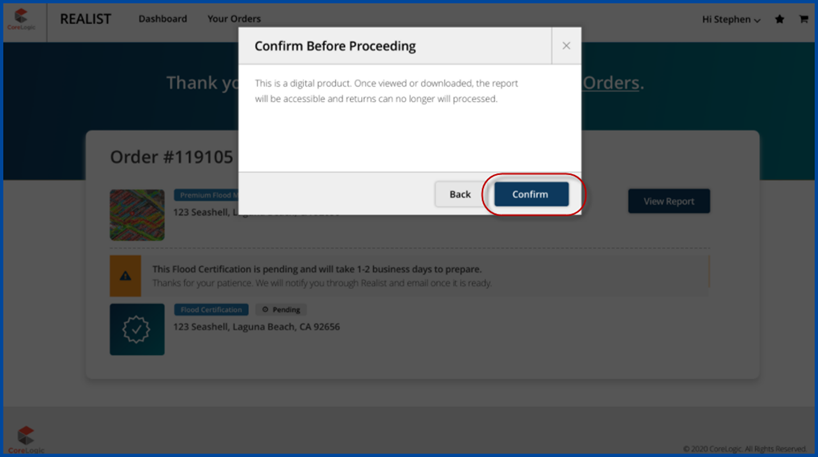
Because the Hazards & Risks report is delivered as a digital product, Realist does not accept returns once you have viewed or accessed the report content. To begin viewing the Premium Flood Map report content, you must acknowledge and accept the refund policy set by clicking the Confirm button.
Glossary/Understanding Risk Profiles
The Hazards & Risks Report provides property-level information for a variety of risks. See below for more details on each risk profile, description, and rating.
Crime Risk Score
CoreLogic, the developers of Realist, provides the most detailed national database of neighborhood crime statistics available through Location Inc., a CoreLogic company. CrimeRisk™ data contains no data about race, color, religion, national origin, sex & orientation, marital status, age, or disability. The database does include statistics for murder, aggravated assault, larceny, robbery, property crime, motor vehicle theft, rape, burglary, and overall total crimes.
| CrimeRisk Score & Description | |
| Risk Score | Risk Description |
| Very Low Risk (0-10) | Crime Risk half the national average or lower |
| Low Risk (11-20) | Crime Risk between half the national average and the national average |
| Moderate Risk (21-40) | Crime Risk from national average to twice the national average |
| High Risk (41-60) | Crime Risk from two to three times the national average |
| Very High Risk (61-80) | Crime Risk from three to four times the national average |
| Extreme Risk (81-99) | Crime Risk from four to five times the national average |
| Very Extreme Risk (100) | Crime Risk five times the national average or higher |
Earthquake Risk Score
Earthquake Risk Score predicts a location’s risk for earthquake damage, along with the potential earthquake severity.
The Earthquake Risk Score incorporates the most current earthquake science and data available. The information intends to serve as an indicator of the extent of ground shaking that could occur at a location in the event of seismic activity. The model combines factors to determine an overall earthquake risk score, ranging from Very Low to Very High risk with a scoring system from 1-100; 100 being the highest risk.
| Earthquake Risk Score & Description | |
| Risk Score | Risk Description |
| 1-19 | Very Low |
| 20-24 | Low |
| 25-60 | Moderate |
| 61-80 | High |
| 81-100 | Very High |
Wind & Storm Risk Score
Wind Risk Score provides information about a location’s risk score on a 1-100 scale, with 100 as the highest risk for tornadic, straight-line, and hurricane wind events.
Wildfire Risk Score
CoreLogic’s Wildfire Risk Score combines brushfire data and proximity to higher risk areas and wildlands to provide an accurate assessment of a property’s exposure to risk. Recent fire activity in the area may actually lower the Risk Description and Score, because accelerant and fuel often deplete after consumption in a fire event. The Risk Score calculates this in the year following the fire, but the reduction is temporary.
| Wildfire Risk Score & Description | |
| Risk Score | Risk Description |
| Low (0-50) | Minimal wildfire threat. Possible ember ignitions based on more distant fuels. |
| Moderate (51-60) | Increased wildfire threat due to closer proximity to ember sources. |
| High (61-80) | Elevated wildfire threat. Ember ignitions from nearby or adjacent fuel sources or possible higher risk fuels on the property. |
| Very High (81-100) | Extreme wildfire threat. Not only embers from nearby fuels but likely higher-risk fuels on the property or in close proximity |
Regional Risks include:
Tsunami
The Tsunami Risk shows you planned areas of evacuation in the event of tsunami. This feature covers the states of California, Hawaii, Oregon, and Washington. It is based on source data available from the Pacific Disaster Center, the National Geophysical Data Center, the Washington Department of Natural Resources, and the California Department of Conservation.
Hailstorm Risk
This report provides a Hail Claim Score (1-100) based on the probability that a property owner will submit a hail claim. The report also includes a Hailstorm Risk Score (1-100), which calculates the possibility of 1″ hailstones impacting the property, along with the annual probability of hailstones from 0.75″ to over 2″ in size. These scores come from analyzing CoreLogic Hail Verification Technology, Storm Prediction Data, and North American Regional Reanalysis data.
Sinkhole Risk
This report uses ground composition data, a comprehensive database of known sinkholes, and scientist-developed methodology that analyzes factors contributing to possible ground collapse. In addition to risk level, the “Sinkhole Integrated” report also provides the distance and status of sinkholes within user-defined distances from the subject property.
Lava
The Hazards & Risk Report can provide lava flow hazard zone information for Hawaii’s largest island. The lava flow hazard zone depictions in this report come from the United States Geological Survey (USGS) and Hawaii Volcanoes Observatory.
Distance to Fire Station
This report includes the distance, in feet, to the three nearest fire stations.
Roof Age
Using building permit data, this report includes the age of a property’s roof for both, residential and commercial property reports. If Realist does not find a permit, the report will use other data, such as year built, to estimate the age of the roof.
Refunds
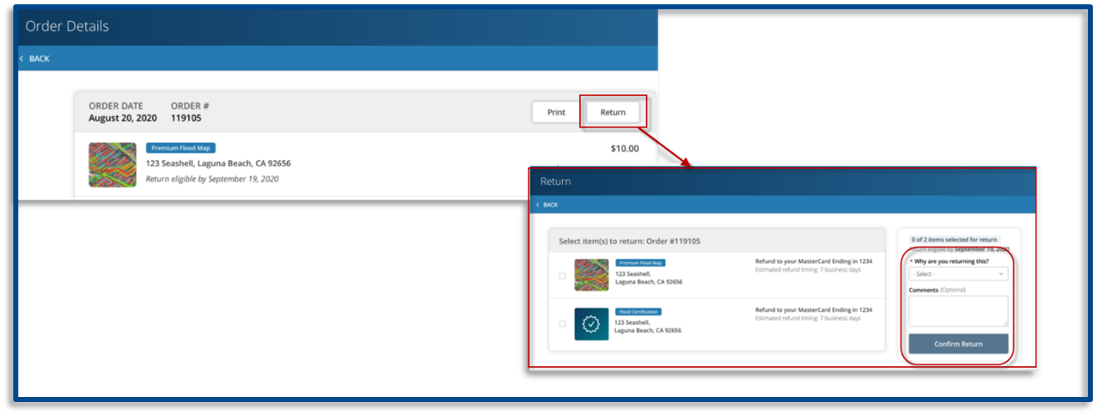
To obtain a refund for a report you haven’t accessed or viewed, click on the Your Orders button to navigate to the order summary page. Click on the Return button located to the right of the eligible report(s), select your return reason, add optional comments, and then click on the Confirm Return button. CoreLogic will issue the refund immediately; however, processing time may take 5-10 days depending on your financial institution.